This is a guest post on insulin load by Michael Alward
Insulin Load – An Introduction
When I first adopted a low carb eating plan, I remember countless questions on low carb support groups as to how to count the carbs / net carbs of various processed food products (on this particular day, it happened to be a protein bar by Quest Nutrition).
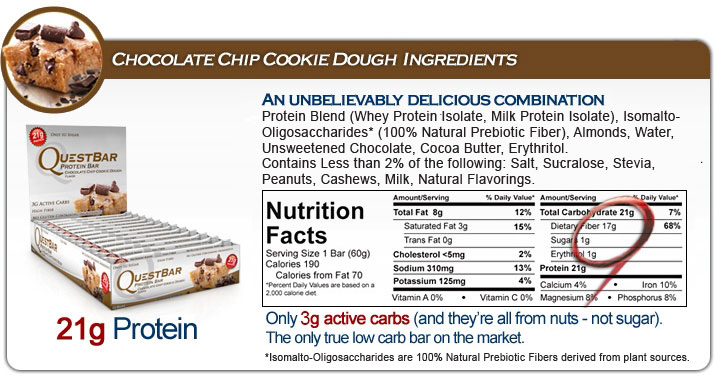
Insulin load – calculating carbs from a Quest Nutrition protein bar.
The answers ranged from 21g of carbs (from a Type 1 Diabetic who tested his real-time insulin response), to “only 3g net carbs” (21g carbs – 17g fibre – 1g erythritol as provided by Quest). Very confusing, and not terribly helpful…
I became increasingly frustrated with the limitations of the grams / net grams approach. When I kept my “carbs” below 25g, my weight dropped. When I kept my “net carbs” below 25g, my weight remained stable. When I kept my “net carbs” below 25g and ate more protein, my weight increased. Simple “carb counting” was not working very well for me.
I wondered if there might be a better approach…
Beyond “Counting Carbs”
I came across a study titled “An insulin index of foods: the insulin demand generated by 1000-kJ portions of common foods” by Holt, Miller and Petocz from the Department of Biochemistry, University of Sydney, Australia (American Journal of Clinical Nutrition, Nov 1997). The study looked beyond the Glycemic Index (GI) which ranks foods according to the extent to which they raise blood glucose concentrations. The following text really caught my attention: “some of the protein-rich foods…fish, beef, cheese, and eggs still had larger insulin responses per gram than did many of the foods consisting predominately of carbohydrate.”
A search for the “Food Insulin Index” lead me to a game changing presentation titled “Managing Insulin to Optimize Nutrition” by Australian Engineer and Type 2 diabetic Marty Kendall (his wife is a Type 1 Diabetic) from the Low Carb Down Under Conference (Nov 2015) and to his website Optimizing Nutrition.
The “Insulin Load” of any given food is calculated as follows:
Insulin Load = Carbohydrates(g) – Fibre(g) + [.56 x Protein(g)]
The chart below shows the insulin load for many common foods based on the formula above:
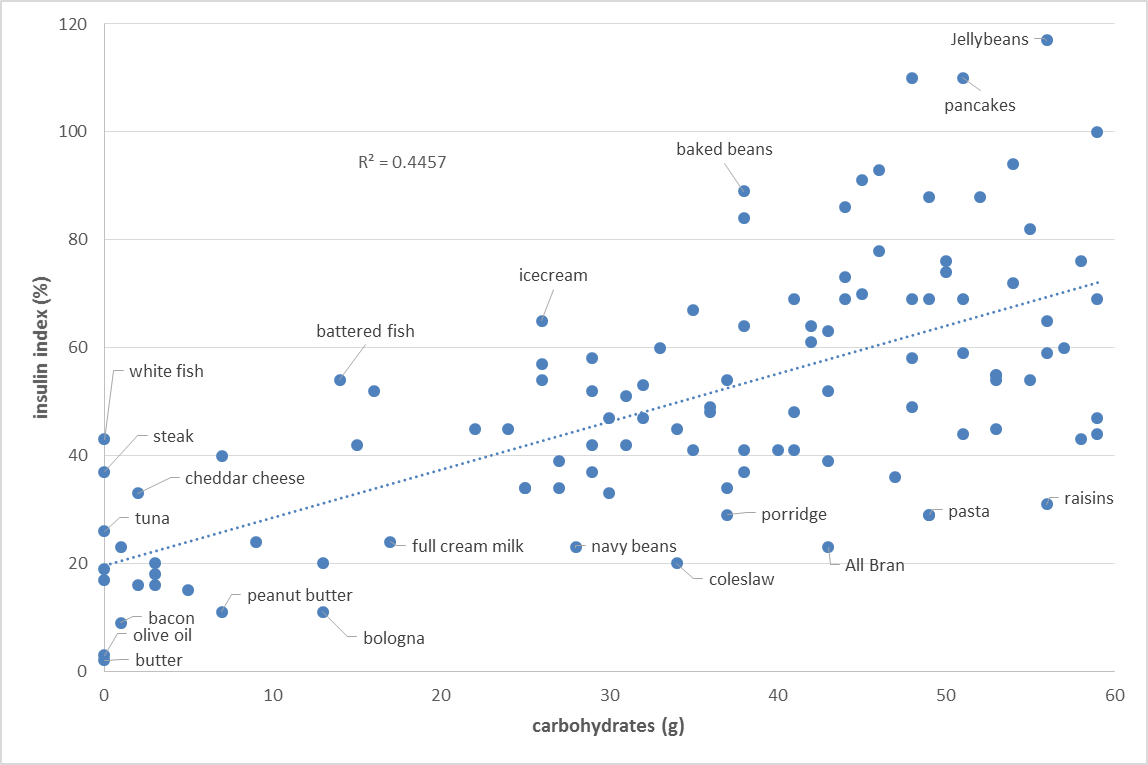
Relationship between carbohydrates and insulin load for common foods
I then used the concept of “insulin load” to pre-plan the macronutrients of my daily meals:
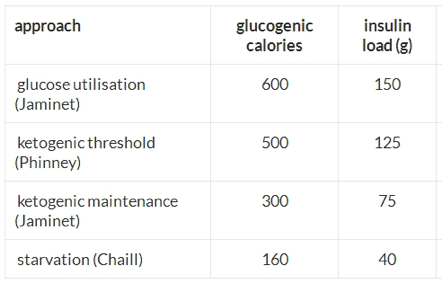
Planning meals using different ketogenic thresholds
I started by targeting the “ketogenic threshold” of 125g attributed to low carb expert Dr. Stephen Phinney (co-author: The Art & Science of Low Carbohydrate Living, The Art & Science of Low Carbohydrate Performance). I was unable to get into ketosis with an insulin load of 125g. I have no doubt that my ketogenic “threshold” is unique to me given my history of metabolic damage and that a metabolically healthy person could very likely enter ketosis at this insulin load level.
I then dialed-down my insulin load target to the “ketogenic maintenance” level of 75g attributed to low-carb paleo scientist Paul Jaminet (author: Perfect Health Diet). At this level, I am able to reach and sustain blood ketone levels above 0.5 mmol (nutritional ketosis). My weight has started to drop again, and my food cravings, especially my cravings for sugar, have greatly diminished.
Tracking Insulin Load with Heads Up Health
I use the Heads Up web application to easily calculate and track insulin load.
1. Automatic calculation
If you’ve connected a nutrition tracking app to your Heads Up account (e.g. MyFitnessPal, Fat Secret, FitBit etc.), Heads Up will automatically calculate insulin load based on the protein/fiber/carb data coming from the nutrition app (figure x):
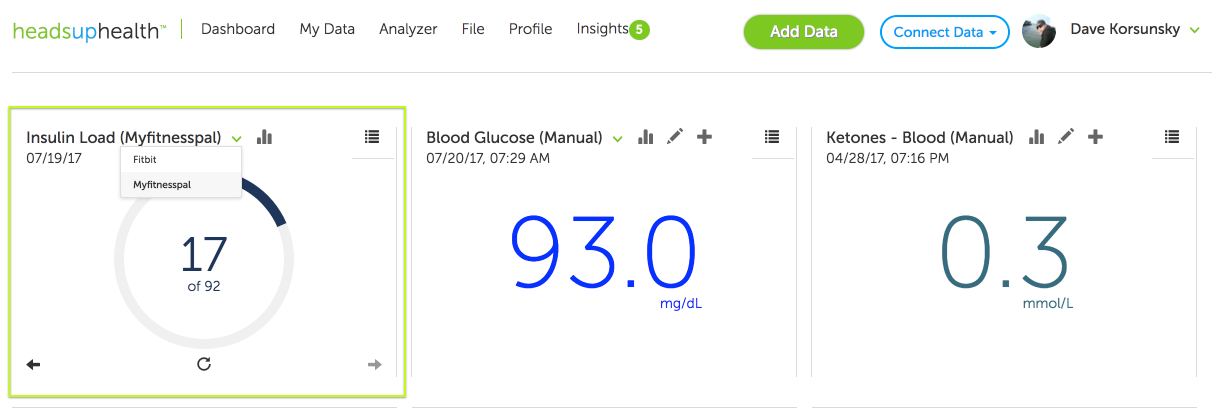
Track Insulin load with MyFitnessPal
2. Manual entry
You can also enter nutrition data manually. Many people still prefer the simplicity of this approach over the food tracking apps available on the market today:
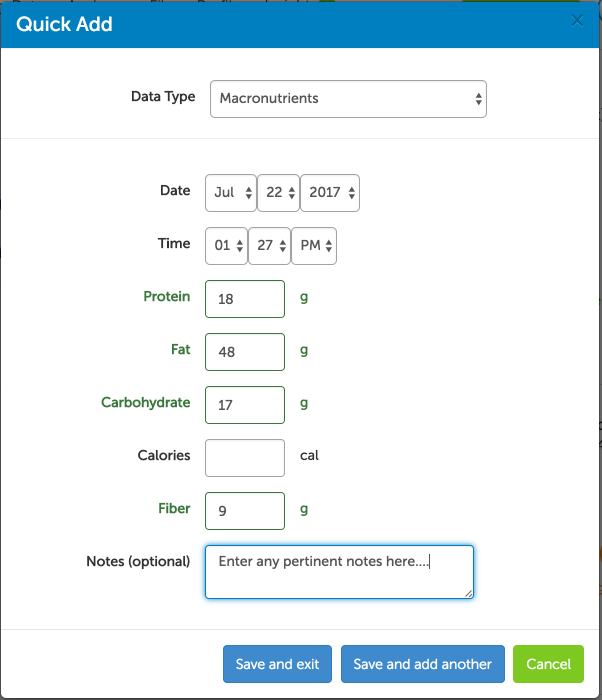
Insulin load – manual entry
Heads Up will then automatically calculate insulin load based on the data you enter manually:
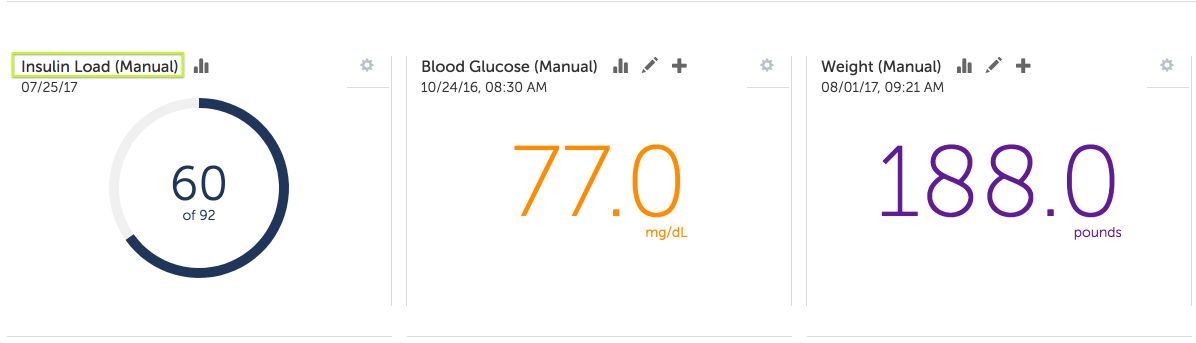
Calculating insulin load manually
You can also trend your insulin load values over time and compare them with other data you are collecting to help you discover optimal levels for your own body. For example, in the graph below, I can easily trend my insulin load values and compare them to my fasting blood sugar readings. I can do the same for weight, ketone levels and any other metrics I choose to collect:
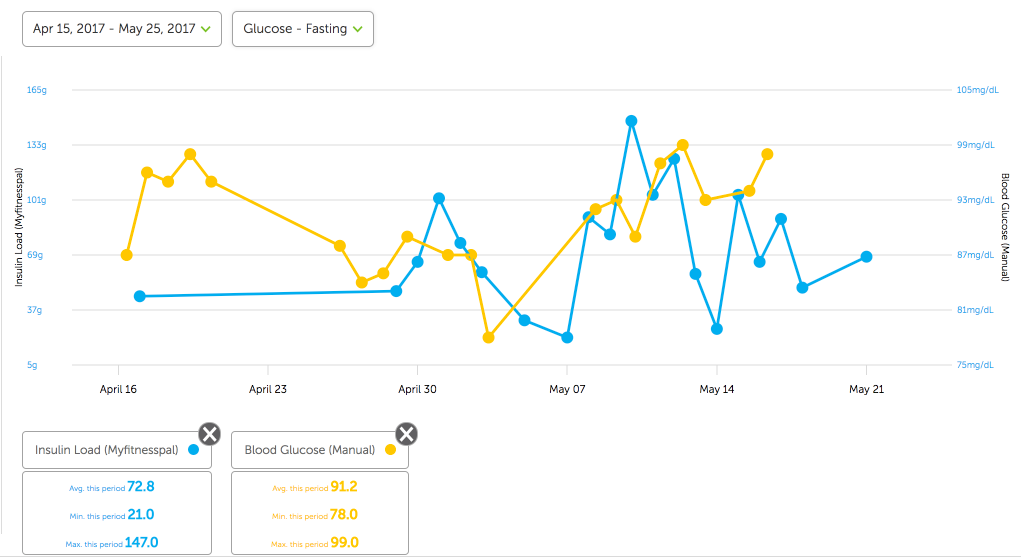
Trending insulin load with blood glucose
I am sure this concept can help others to reduce the insulin load of their meals, which is critical for weight loss and metabolic health.
The journey back to health continues…
Michael Alward
An “empowered patient”

Michael is a former self-confessed food dope. He is on a health “nerd safari” recovering from metabolic syndrome, gout, sleep apnea, pre-Diabetes, sugar addiction and morbid obesity. He is following a very low carb, sugar-free, ketogenic eating plan and practices intermittent fasting.


We stumbled over here coming from a different web page and thought I might check things out. I like what I see so now i’m following you. Look forward to looking at your web page yet again.
It’s remarkable in support of me to have a web site, which is valuable in favor of my know-how. thanks admin
I like the article
How much of an insulin load would you have per meal? I usually have 20-30.
Inspiring article. Bravo. I am on the same track
Is the insulin load of different foods eaten at the same time compounded or is it based on the food with the highest load?
Ex, if I had coleslaw and steak. Is the insulin load 60 or 40?
A very good article. It confirms my experience. My threshold seems to be about 60. Thanks for the Marty Kendall video and the Heads Up App. I will give it a try!
confounding factors include insulin stimulating meds, and steroids which significantly raise BG
I would like to know how to calculate the Insulin Index of my foods or get a food list of low Insulin Index foods.
Would things like Eaas or some alcohol sugars mess up our insulin load calculations given they don’t really show up in trackers as having a macronutrient value? Even if they don’t i believe some of that stuff has an effect on insulin…any knowledge on this?
Thanks!
Carl