For many people, using periodic tape measurements is much more effective than a typical scale for tracking changes in body composition.
We will cover the best practices for effectively using body tape measurements in this post.
You can track your body tape measurements alongside all your other vital health metrics using the Heads Up app. Get started using the button below. Or, read on to learn the basics of using the tape measure to track your body composition!
[maxbutton id=”4″]
Why Track Body Tape Measurements?
Scales don’t tell the full story
In many cases, you may be adhering to a well-designed nutrition and exercise plan but weight on the scale is not coming down the way you would like (it may even be increasing…). However, you notice your clothes are starting to fit better and you are looking and feeling thinner and more energetic.
This is a common scenario. Although the absolute number on the scale isn’t moving the way you’d like, your body composition is indeed improving dramatically as fat is lost and lean muscle is gained. Body tape measurements are an excellent way to understand how your body composition is improving in these scenarios.
Track muscle development
If strength training is part of your regimen, body tape measurements are a great way to understand which muscle groups are growing and which may need to be attacked differently.
Track your progress over time
One of the most rewarding parts about making healthy lifestyle changes is having a record of your progress over the course of months or even years so you can see how far you’ve come.
Compare with other metrics
Body tape measurements are a great way to understand *where* you are gaining, but it is also important to know *what* your are gaining. Thus, we also recommend tracking body fat percentage so you can determine if the gains are from muscle or fat.
Additionally, Heads Up can help you compare your body tape measurements with all other health and fitness data (blood sugar, diet, exercise etc.) so you have a complete picture of how your lifestyle choices are affecting body composition.
How to track body tape measurements with Heads Up
Step 1: Enter measurements
To get started, simply add the ‘Measurements’ tile to your dashboard so you can track these values alongside other important health metrics:
Add measurements to your dashboard
Then simply use the ‘+’ button on the measurements tile to add new measurements:
Enter your body tape measurements
Step 2: Track progress
Using the Heads Up app, you can graph your measurements over time to track your progress.
You can also graph your measurements together with other health metrics.
For example, it is well known that lowering blood sugar is an extremely effective way to lose weight. In the graph below, we can see how blood sugar and ketones, which sync automatically from the Keto-Mojo meter, compare to body tape measurements.
Compare measurements with ketones and blood sugar from the Keto-Mojo meter.
Step 3: Re-measure every few weeks
Periodically re-measure so you can correlate changes with your diet, exercise and lifestyle.
Best practices for body tape measurements
A few tips to ensure you are getting the most out of the body tape functionality in Heads Up:
Consistency: Your goal with body tape measurements is consistency. The tape should be pulled to where it is lying flat against the skin all the way around. The pressure you put on the tape isn’t that important; it is only important that it is the same every time you do it. Use the same process every time you measure to ensure accurate results.
Dominant side: For measurements such as bicep, forearm, calf and thigh, we recommend using your dominant side to collect measurements.
That’s it! You can create your Heads Up account and start tracking measurements using the button below.
If you’ve got comments, questions and/or feedback on how we can improve this feature, please contact us.
This is the second installment in a series of articles exploring pertinent lab tests for people following low-carb diets, and how a slightly different perspective is needed when interpreting the results compared to results from people following high-carb diets.
In the previous post in this series, we looked at three measurements related to blood glucose: fasting glucose, hemoglobin A1c, and fructosamine. We left off saying that while these are important to monitor regularly, they offer a limited view of a much larger metabolic control system. Blood glucose, hemoglobin A1c (HbA1c), and fructosamine indicate only what’s happening with blood glucose. They reveal nothing about insulin, which we will explore in this post.
Knowing your numbers is an important step for anyone who wants to transform their health. Heads Up Health was designed to empower you to manage all of your health data, including your lab test results, in one secure location. You can learn more on our homepage or by clicking below to create your account and start building your own centralized health portfolio.
[maxbutton id=”4″]
The Fasting Insulin Test
We said it last time, and it’s worth repeating:
A fasting insulin test is the most important test your doctor probably isn’t ordering.
The reason it’s so important to track insulin is that in many cases, fasting glucose and A1c remain normal due to chronically elevated insulin—that is, sky-high insulin is keeping the glucose “in check.” Fasting glucose and HbA1c are often the last things to rise, and they become elevated only after one of two things has happened:
The pancreas can no longer pump out the inordinate amounts of insulin required to keep blood glucose within a safe range (sometimes called “beta-cell burnout”). This is relatively rare, except in type-1 diabetes, which is an autoimmune condition and not driven by a poor diet.
The pancreas still secretes large amounts of insulin but some of the body’s cells no longer respond to it properly, resulting in high blood glucose. (These cells become resistant to the presence of insulin.) This is far more common.
This explains why many people are surprised by a diagnosis of type 2 diabetes or pre-diabetes. They—and their doctors—had been lulled into a false sense of security by glucose measurements that fell within normal ranges for years, because no one was measuring insulin.
Medical professionals who are aware of the wide-ranging effects of chronically elevated insulin would agree that a fasting insulin test should be included as a standard part of routine bloodwork. But until that happens, if you’re concerned with getting and remaining metabolically healthy, you will need to specifically request it from your doctor or order it on your own from a direct-to-consumer lab testing service.
Insulin helps control blood glucose.
Here’s how to use a fasting insulin test as a gauge for metabolic health:
Optimal range: 1- 9 μU/mL
Intermediate risk range: 10 -11 μU/mL
High risk range: ≥ 12 μU/mL
If your fasting insulin is in the double digits, it’s a sure sign something is awry. However, just as we explained regarding fasting glucose, if your fasting insulin falls within the optimal range, it doesn’t automatically mean everything’s fine. In some people, the fasting level is normal, but the level after meals rises very high and takes an extended length of time to come back to baseline—if it even does come down fully before the next meal. So it’s possible to have a fasting insulin level in the optimal range but have high insulin throughout most of the rest of the day.
Chronically elevated insulin ( called “hyperinsulinemia”) should be suspected when fasting glucose, HbA1c, and possibly fasting insulin are normal, but you experience unexplained or “idiopathic” health issues, such as:
Stubborn fat loss
Hypertension (high blood pressure)
Headaches; migraines
Gout
Skin tags
Vertigo
Tinnitus
Infertility (in women and men)
Erectile dysfunction
Benign prostatic hyperplasia
Polycystic ovarian syndrome (PCOS)
Gynecomastia (enlargement of breast tissue in males)
Unfortunately, owing to the complexity of the chemical assay used to measure insulin, there’s currently no way to measure insulin at home, the way you can do with glucose and HbA1c.
Why Track Insulin?
Medical professionals—particularly physicians, nutritionists, and researchers who work with individuals with obesity, type-2 diabetes, and metabolic syndrome—increasingly recognize that it is elevated insulin, rather than blood glucose, that’s responsible for many of the chronic illnesses that plague millions of people, robbing them of quality and quantity of life. Chronically elevated blood glucose (“hyperglycemia”) is dangerous and, over time, results in damage to the eyes, kidneys, liver, blood vessels, and extremities. Much of the organ and tissue damage that occurs in type-2 diabetics with poor blood sugar control results from chronic hyperglycemia.
But, many non-diabetics will experience physical deterioration in the absence of high blood glucose. In these individuals, it’s the insulin that’s the problem. These folks are essentially diabetic, but because their blood glucose is normal, they won’t be officially diagnosed. This is what Dr. Joseph Kraft called “diabetes in-situ,” or “occult diabetes”—occult, meaning hidden. The high blood sugar is hidden or masked by the pathologically high insulin.
Something to keep in mind is that hyperinsulinemia occurs in people of all shapes and sizes. Obesity is more often an effect, rather than a cause, of disturbed insulin and glucose signaling in the body. So individuals who are lean and appear healthy on the outside are not immune to the adverse effects of high insulin. These individuals have personal body fat set points that prevent them from becoming overweight or obese, but they’re not spared the other undesirable outcomes from derailed metabolism. (Researchers call this “normal weight obesity,” but more casually it’s referred to as TOFI – thin outside, fat inside. Even though these folks remain at a “normal” weight, their biomarkers indicate metabolic syndrome or insulin resistance.)
Tracking insulin is the canary in the coal mine – the “check engine light.” It’s an early warning sign that your diet and lifestyle need adjustments. You don’t have to wait until your blood glucose is high enough to prompt a type-2 or pre-diabetes diagnosis. Elevated fasting insulin might be one of the first indicators that something’s amiss, and you can take action to correct it.
Track your progress
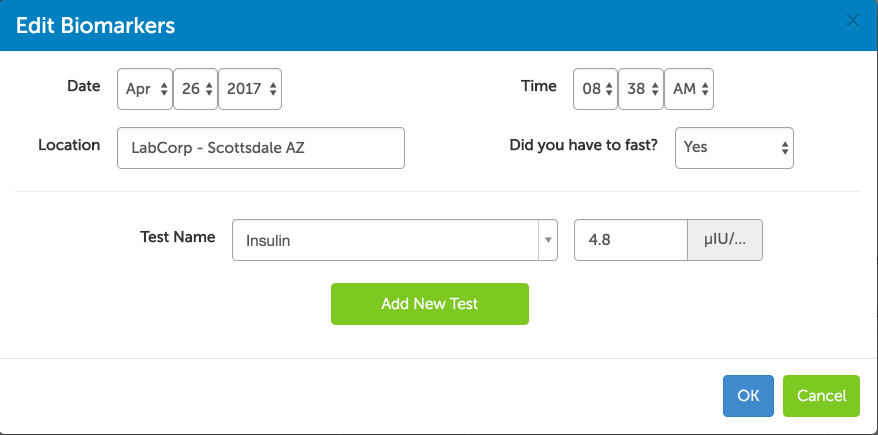
The Heads Up Health app was designed specifically for individuals to take control of their health data so it can be used for better decision-making. For our users within the United States, you can electronically link your medical facility to your Heads Up account and instantly import your lab test results. If we can’t connect to your medical facility or you live outside the US, you can easily enter your results manually:
Track your fasting insulin results with Heads Up Health
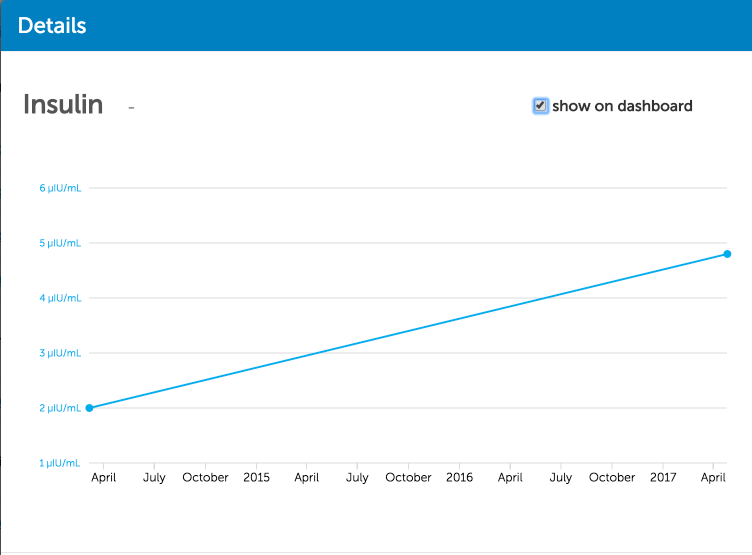
With subsequent tests, you can also trend your results over time to see how your low-carb lifestyle is impacting important markers like fasting insulin:
Trending your fasting insulin results over time
Heads Up can also integrate the data you are collecting at home – everything from weight to blood sugar and steps per day – so you can compare how your healthy lifestyle choices are impacting your lab test results.
[maxbutton id=”4″]
Coming up next…
In the next post, we’ll introduce you to the HOMA-IR test that will help you connect your fasting insulin and glucose levels for a deeper analysis of your level of metabolic health.
Welcome to part 1 of our series on low-carb lab testing. In this first post, we look at three tests that can be used to monitor your blood glucose levels. In subsequent posts, we’ll shift focus to insulin, lipids, thyroid and other markers that are important for patients to understand.We’ll help you understand what these tests mean and how to track your results so you are in the driver’s seat when it comes to you health!
Heads Up Health is a web app designed to help you centrally track all of your vital health data – including your blood test results. Instantly synchronize your medical records, connect your favorite health devices and apps and use your data to optimize your health! Click on the button below to create your account. Or, read on for more information about common tests to help you monitor your blood sugar levels.
[maxbutton id=”5″]
Blood sugar, insulin and health
Chronic, long term pathological elevations in blood glucose or insulin have been linked to type 2 diabetes, obesity, Alzheimer’s disease, kidney problems, deterioration of eyesight, neuropathy, poor prognosis in cancer, connective tissue irregularities, orthopedic injuries and more. Links and associations are not necessarily causal relationships, but the medical literature is robust with research detailing potential mechanisms by which chronically high blood glucose or insulin might be either directly causing or at the very least exacerbating these outcomes. With this in mind, if you’re concerned about your long term health and quality of life, keeping blood glucose and insulin within healthy ranges is one of the most important and effective things you can do.
There are a number of blood tests that can help you keep track of your glycemic control. Results within the healthy ranges can keep you on the straight and narrow, while results that fall outside the optimal range can serve as a wakeup call if you need to be nudged back onto the path. Here we’ll look at few of the relevant tests and determine their proper place in helping you ensure optimal health and graceful aging.
Before we get into things, though, keep this in mind: your health is a mosaic, not a snapshot. It’s a whole picture, made up of many interrelated and interdependent factors. You should neither become alarmed nor rest assured based on any one measurement in isolation. Rather, you and your healthcare team should consider the sum total of the interactions that contribute to your overall health status. It’s easy to get a false sense of security—or become unnecessarily worried—based on one single measurement of any of the parameters below. So, for each one, we’ll tackle what it is, what it means, and why a high or low reading might be misleading.
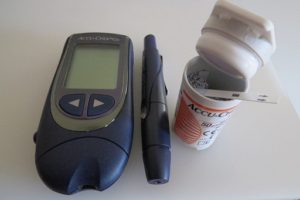
Fasting blood glucose
Blood sugar test – fasting glucose
This is exactly what it sounds like—a measurement of your blood glucose level after it’s been about 8-12 hours since you’ve last eaten. (It’s typically performed in the morning, after an overnight fast.)
However: a fasting level of less than 100 mg/dL (5.5 mmol/L) doesn’t automatically mean you’re in the clear, good to go, and all that jazz. A fasting glucose measurement is just a snapshot in time—one measurement at one moment. Unless it’s very high, it’s hard to take away any definitive information from this. Fasting blood glucose can be elevated for a couple of reasons that are not indicators of diabetes:
Stress: Don’t underestimate the impact of stress on blood sugar. If you were stuck in a traffic jam or had a hectic morning before arriving at the lab, your blood sugar might be higher than it otherwise would have been, and it’s because of the aggravation, not because you’re careening toward a type 2 diabetes diagnosis. Feeling especially nervous around doctors or phlebotomists (“white coat syndrome”) may also play a role.
Low carb diets: Fasting blood glucose might be slightly higher than expected in people who’ve been following a low carbohydrate or ketogenic diet for a significant amount of time. This is sometimes referred to as “physiological insulin resistance,” but a more descriptive phrase is “adaptive glucose sparing.” What it means is that in people whose metabolisms are primarily powered by fat, rather than glucose (they are “fat adapted”), the muscles and many of the body’s other tissues preferentially run on fat and ketones, thus “sparing” glucose for the tissues with an absolute requirement for it, such as the brain, red blood cells, and select other cells. In this case, the slight elevation in fasting glucose is to be expected and is not considered pathological.
So how do you know whether a slightly elevated fasting glucose is problematic? This brings us to our next test.
[maxbutton id=”5″ url=”https://headsuphealth.com” text=”Track Your Lab Tests!” ]
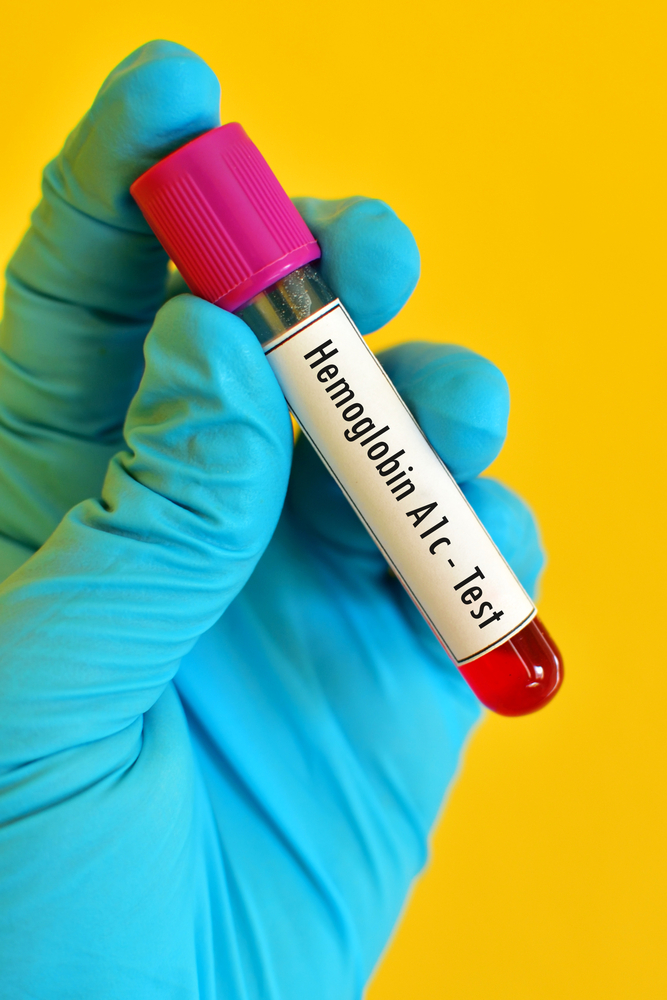
Hemoglobin A1C
This is a measurement of the average blood glucose over approximately the previous two to three months. (Hemoglobin is a protein in red blood cells that contains iron and transports oxygen. This test measures glycated hemoglobin – hemoglobin that has become “sticky” with glucose.) This is a more reliable test than fasting glucose for indicating abnormalities in glycemic control. If your fasting glucose is slightly high but your A1c is optimal, then one of the above non-pathological reasons might explain your higher fasting reading.
Blood sugar test – Hemoglobin A1c
Here’s how the ADA classifies hemoglobin A1c with regard to indicating diabetes:
Pre-diabetes: 5.7-6.4%
Type 2 diabetes: ≥ 6.5%
Most low-carb savvy doctors would prefer to see A1c below 5.5%. However, just like with the fasting reading, there are reasons why A1c isn’t always a reliable marker:
Low carb diets: Good health strikes again! The reason A1c is considered to measure a two to three (or four) month average blood glucose is because the lifespan of red blood cells is typically 100-120 days. But red blood cells (RBCs) that are especially healthy and hardy might stick around a bit longer, which gives them more time to become glycated. So with a slightly elevated A1c, we have yet another measurement that could be alarming if taken out of its proper context. Individuals following low carb or ketogenic diets for a while might have long-lived RBCs, and thus a higher A1c than they would expect based on their diet and lifestyle. If you check your blood glucose regularly and rarely or never see it elevated into hyperglycemic territory but have a higher A1c than you would expect, this is likely the reason.
Anemia: Individuals with anemia (including sickle cell anemia) have red blood cells with shorter lifespans and thus might have an artificially low A1c reading. (Any other condition that shortens RBC survival time or increases RBC turnover can also result in a falsely low A1c.)
Great. So neither fasting glucose nor A1c can always be relied upon? What now?
Well, if your fasting glucose or A1c reading surprises you and you’d like some reassurance that you’re not headed into choppy seas, there’s another test that can put your mind at ease:
Fructosamine
This is a helpful test to include if your A1c is known or suspected to be unreliable. This test is similar to the A1c, but rather than an average blood glucose over the previous few months, fructosamine indicates glycemic control during the previous 2-3 weeks. Fructosamine is a compound formed when glucose combines with certain proteins, such as albumin, which is the most abundant protein in blood. Proteins exist in the blood for less time than the lifespan of a red blood cell. They’re around for about 14 to 21 days, so the glycated proteins the fructosamine test measures reflect average glucose levels during this timeframe. Some tests assess the glycation of total serum proteins, while others assess the glycation of albumin, specifically. (Some labs use the name Glycated Serum Protein [GSP] rather than fructosamine.)
There are currently no widely accepted standard reference ranges for fructosamine. The reference values depend on a person’s age, gender, and the testing method employed.
In addition to giving a good picture of glycemic control when fasting glucose or A1c is unreliable, fructosamine is also helpful for guiding changes in diabetes treatment. Because it reflects changes that occur within weeks, rather than months, it’s useful for gauging the efficacy of changes in diet, medication, and lifestyle.
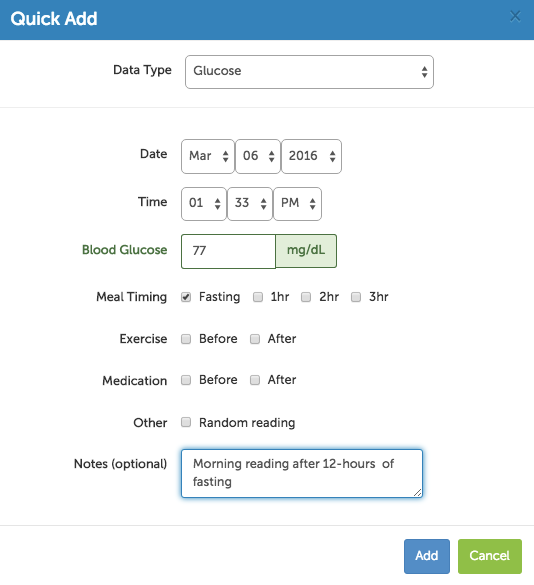
Tracking your progress
Heads Up Health was designed to help you manage all of your health data in one place so you can see the big picture when it comes to your low-carb lifestyle. If you are testing your blood sugar at home with a glucometer, you can easily track this data within your Heads Up Health profile:
Blood sugar testing – track your progress with Heads Up Health
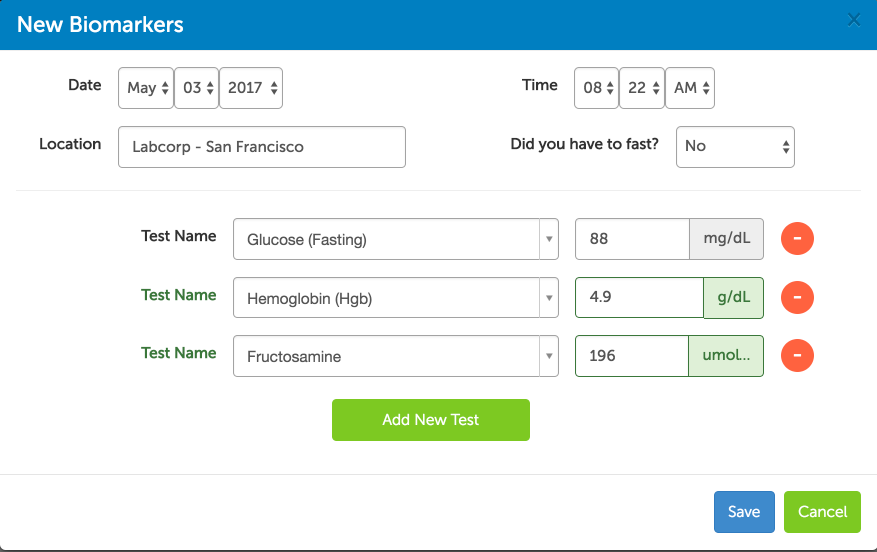
Heads Up can also integrate your lab test results so you can see how your low-carb lifestyle is affecting metrics like hemoglobin A1c and fructosamine:
Track your lab test results
You can also track your blood sugar, ketones, body composition and any other health metrics that are important to you. Click the button below to create your account and start tracking your results!
[maxbutton id=”5″ ]
What to Do About All This
We’ve taken a look at some of the most common tests that can be used to monitor your blood glucose. We’ve also covered some reasons why these markers of blood glucose control might be a bit higher or lower than you’d expect. But what about when they’re normal? If your fasting glucose, A1c, and fructosamine are all normal, can you sit back, relax, and keep on keepin’ on’?
The obvious—and easy—answer to this is yes. But like so much in medicine and science, the obvious and easy answer isn’t always the right answer. The truth is, even if all those measurements look good, something else could throw your health for a loop. Because there’s one thing—a very big thing—that none of those tests measure. Fasting glucose, A1c, and fructosamine are all measures of what’s happening with glucose. They tell you nothing about insulin.Fasting insulin is the most important test your doctor probably isn’t ordering.
And if you are ready to start tracking your own lab test results, click the button below to start your free trial for Heads Up Health. We’ll empower you with the data you need to master your health!
[maxbutton id=”4″]
Stay tuned. We’ll look at measuring insulin—and why it’s so important—in our next post in this series.
We use cookies to ensure that we give you the best experience on our website. If you continue to use this site we will assume that you are happy with it.I consentView Privacy & Cookie Policy